Reusable Charts with Laravel Livewire
For my project GPMetrics I need charts to display data. In this blog article I will explain how I implemented these using ChartJS and Laravel livewire in a way that they are reusable.


I am currently building GPMetrics which is a site to visualize F1 data. To do this I chose ChartJS but I prefer to do most code in PHP. I ended up writing a reusable Livewire component to quickly create different charts without touching Javascript for each chart.
I chose to use ChartJS because it contains all the chart types that I need, but if I ever want to swap it for another component I should only have to swap the base components and the way data is delivered.
My requirements are these:
Configuration via PHP
Uses ChartJS
Default configuration for all charts
Updates with Livewire events
Minimal JS
Data caching
Possibility to extend
Base Component
I started by creating a base component for the charts which includes some default configuration for all charts and a way to lazy-load the data.
<?php

namespace App\Livewire\Charts;

use Illuminate\Support\Str;
use Illuminate\View\View;
use Livewire\Component;

abstract class BaseChart extends Component
{
    public string $title = 'Chart';

    public abstract function data(): array;

    public function description(): string
    {
        return '';
    }

    public function loadChart(): void
    {
        $data = array_merge_recursive($this->defaultOptions(), $this->data());

        $this->dispatch($this->getIdentifier().'-update-chart', $data);
    }

    public function render(): View
    {
        return view('livewire.charts.base-chart', [
            'identifier' => $this->getIdentifier(),
            'description' => $this->description(),
        ]);
    }

    public function defaultOptions(): array
    {
        return [
            'options' => [
                'maintainAspectRatio' => false,
                'responsive' => true,
                'scaleShowValues' => true,
                'borderWidth' => 4,
                'borderJoinStyle' => 'round',
                'tension' => 0,
                'pointRadius' => .5,
                'pointHitRadius' => 10,
                'plugins' => [
                    'legend' => [
                        'position' => 'bottom',
                    ],
                    'title' => [
                        'display' => false,
                    ],
                ],
            ],
        ];
    }

    protected function getIdentifier(): string
    {
        return Str::slug(get_class($this));
    }
}
I carefully did not overwrite the mount method so that I can implement that in the child classes to be able to force parameters that are needed to collect the data.
The view looks like this:
<div wire:init="loadChart">
    <x-card :title="$title">

        <x-slot name="header">
            <p class="text-gray-400">{!! nl2br($description) !!}</p>
        </x-slot>

        <div>

            <div
                wire:ignore
                x-init="() => {
            Livewire.on('{{ $identifier }}-update-chart', params => {
                config = params[0]

                show = config.data.labels.length > 0

                let chart = Chart.getChart('{{ $identifier }}');

                if (typeof chart === 'undefined') {
                    chart = new Chart(document.getElementById('{{ $identifier }}'), config);
                } else {
                    chart.type = config.type;
                    chart.data = config.data;
                    chart.options = config.options;
                    chart.update();
                }
             });
        }">
                <canvas wire:ignore id="{{ $identifier }}"></canvas>
            </div>
        </div>
    </x-card>
</div>
Each time the identifier update-chart event fires it updates the chartJS.
To use this I simply create a class that extends the BaseChart class and implement the data method. When I need extra data
For example:
class TeamPointsYearPie extends BaseChart
{
    public string $title = 'Constructor points';

    public int $year;

    public function mount(int $year): void
    {
        $this->year = $year;
    }

    public function description(): string
    {
        return "Points per team in the {$this->year} season.";
    }

    public function data(): array
    {
        $results = RaceResult::query()
            ->join('races', 'race_results.race_id', '=', 'races.id')
            ->selectRaw('SUM(pts) AS pts, team_id')
            ->where('races.year', '=', $this->year)
            ->orderByRaw('SUM(pts) DESC')
            ->groupBy('team_id')
            ->get();

        $teams = Team::query()->whereIn('id', $results->pluck('team_id')->unique())->get();

        $labels = [];
        $points = [];
        $colors = [];

        $totalPoints = $results->sum('pts');

        foreach ($results as  $teamResult) {
            /** @var ?Team $team */
            $team = $teams->firstWhere('id', '=', $teamResult->team_id);

            if ($team === null) {
                continue;
            }

            $percent = round(($teamResult->pts / $totalPoints) * 100, 2);

            $labels[] = "$team->name ($percent%)";
            $colors[] = $team->color;
            $points[] = $teamResult->pts;
        }

        return [
            'type' => 'doughnut',
            'data' => [
                'labels' => $labels,
                'datasets' => [
                   [
                       'label' => 'Points in ' . $this->year,
                       'data' => $points,
                       'backgroundColor' => $colors,
                       'borderWidth' => 0,
                   ],
                ],
            ],
            'options' => [
                'cutout' => '80%',
                'radius' => '90%',
            ]
        ];
    }

    public function defaultOptions(): array
    {
        $options = parent::defaultOptions();

        data_set($options, 'options.plugins.legend.position', 'left');

        return $options;
    }
}
Adding caching, height adjustibility and loading indicators
The extra features that I want for each chart are caching, buttons to adjust the chart height and loading indicators.
To do this I've adjusted the BaseChart class, I've added a $controls property, added caching and a cache key method.
abstract class BaseChart extends Component
{
    public string $title = 'Chart';

    public bool $controls = true;

    public abstract function data(): array;

    public function description(): string
    {
        return '';
    }

    public function loadChart(): void
    {
        $data = cache()->remember(
            $this->getCacheKey(),
            now()->addHour(),
            fn () => array_merge_recursive($this->defaultOptions(), $this->data())
        );

        $this->dispatch($this->getIdentifier().'-update-chart', $data);
    }

    public function render(): View
    {
        return view('livewire.charts.base-chart', [
            'identifier' => $this->getIdentifier(),
            'description' => $this->description(),
        ]);
    }

    public function defaultOptions(): array
    {
        return [
            'options' => [
                'maintainAspectRatio' => false,
                'responsive' => true,
                'scaleShowValues' => true,
                'borderWidth' => 4,
                'borderJoinStyle' => 'round',
                'tension' => 0,
                'pointRadius' => .5,
                'pointHitRadius' => 10,
                'plugins' => [
                    'legend' => [
                        'position' => 'bottom',
                    ],
                    'title' => [
                        'display' => false,
                    ],
                ],
            ],
        ];
    }

    protected function getIdentifier(): string
    {
        return Str::slug(get_class($this));
    }

    protected function getCacheKey(): string
    {
        return $this->getIdentifier();
    }
}
The view now looks like this:
<div wire:init="loadChart" x-data="{show: false, loading: true}">
    <div class="flex justify-center mx-auto items-center w-full border-y border-transparent" x-show="loading">
        <span class="inline-block border-4 border-red border-r-transparent motion-safe:animate-spin rounded-full my-2 p-2"></span>
    </div>
    <x-card :title="$title" x-show="show">

        <x-slot name="header">
            <p class="text-gray-400">{!! nl2br($description) !!}</p>
        </x-slot>

        <div x-data="{ height: 400 }">

            <div
                wire:ignore
                x-init="() => {
            Livewire.on('{{ $identifier }}-update-chart', params => {
                config = params[0]

                show = config.data.labels.length > 0
                loading = false

                let chart = Chart.getChart('{{ $identifier }}');

                if (typeof chart === 'undefined') {
                    chart = new Chart(document.getElementById('{{ $identifier }}'), config);
                } else {
                    chart.type = config.type;
                    chart.data = config.data;
                    chart.options = config.options;
                    chart.update();
                }
             });
        }">
                <canvas wire:ignore id="{{ $identifier }}" x-bind:style="'height: ' + height + 'px;'"></canvas>
            </div>

            @if ($controls)
                <div class="flex w-full justify-end gap-4 mt-2">
                    <x-button x-on:click="height > 100 ? height -= 100 : false" class="gap-1">
                        <x-heroicon-m-bars-arrow-up class="w-4 h-4"/>
                        Make Smaller
                    </x-button>
                    <x-button x-on:click="height = 400" class="gap-1">
                        <x-heroicon-m-bars-3 class="w-4 h-4"/>
                        Reset
                    </x-button>
                    <x-button x-on:click="height += 100" class="gap-1">
                        <x-heroicon-m-bars-arrow-down class="w-4 h-4"/>
                        Make Larger
                    </x-button>
                </div>
            @endif
        </div>
    </x-card>
</div>
Year filters
A lot of my charts have to be filtered by year, I want to add two input fields below each chart to enter a start and ending year. I created a new abstract Livewire component that inherits from the BaseChart and added the neccecary methods for setting the years.
Each time the year is updated it will reload the chart data.
abstract class BaseYearChart extends BaseChart
{
    protected $listeners = [
        'updatedYears',
    ];

    public ?int $startYear = null;
    public ?int $endYear = null;

    public abstract function minYear(): int;

    public abstract function maxYear(): int;

    public function updatedYears(int $start, int $end): void
    {
        $this->startYear = $start;
        $this->endYear = $end;

        $this->loadChart();
    }

    public function updated(string $name): void
    {
        if ($name === 'endYear' && $this->endYear <= $this->startYear) {
            $this->startYear = $this->endYear;
        }

        if ($name === 'startYear' && $this->startYear >= $this->endYear) {
            $this->endYear = $this->startYear;
        }

        $this->loadChart();

       $this->dispatch('updatedYears', $this->startYear, $this->endYear);
    }

    public function render(): View
    {
        if ($this->endYear === null) {
            $this->endYear = max($this->maxYear(), now()->year);
        }

        if ($this->startYear === null) {
            $this->startYear = max($this->minYear(), now()->subYears(3)->year);
        }

        return view('livewire.charts.base-year-chart', [
            'identifier' => $this->getIdentifier(),
            'description' => $this->description(),

            'minYear' => $this->minYear(),
            'maxYear' => $this->maxYear(),
        ]);
    }

    protected function getCacheKey(): string
    {
        return $this->getIdentifier() . $this->startYear . $this->endYear;
    }
}
With the corresponding view:
<div wire:init="loadChart" x-data="{show: false, loading: true}">
    <div class="flex justify-center mx-auto items-center w-full border-y border-transparent" x-show="loading">
        <span class="inline-block border-4 border-red border-r-transparent motion-safe:animate-spin rounded-full my-2 p-2"></span>
    </div>
    <x-card :title="$title">

        <x-slot name="header">
            <p class="text-gray-400">{{ $description }}</p>
        </x-slot>

        <div x-data="{ height: 400 }">

            <div wire:ignore x-init="() => {
                Livewire.on('{{ $identifier }}-update-chart', config => {
                    config = config[0]

                    show = config.data.labels.length > 0
                    loading = false

                    let chart = Chart.getChart('{{ $identifier }}');

                    config.options.plugins.tooltip = {
                        callbacks: {
                          title: function(context) {
                             let index = context[0].dataIndex;
                             let dataset = context[0].dataset;

                             let meta = dataset.meta ?? {};
                             let tooltips = meta.tooltips ?? [];

                             let tooltip = tooltips[index] ?? null;

                             if (tooltip === null) {
                                 return context.label;
                             }

                            return tooltip;
                          },
                        }
                    };

                    if (typeof chart === 'undefined') {
                        chart = new Chart(document.getElementById('{{ $identifier }}'), config);
                    } else {
                        chart.type = config.type;
                        chart.data = config.data;
                        chart.options = config.options;
                        chart.update();
                        console.log('data');
                    }
                 });
            }">
                <canvas wire:ignore id="{{ $identifier }}" x-bind:style="'height: ' + height + 'px;'"></canvas>
            </div>

            <div class="flex justify-between">

                <form wire:submit class="flex gap-2">
                    <div class="">
                        <x-label for="startYear" value="{{ __('From Year') }}"/>
                        <x-input id="startYear" type="number" class="mt-1 " wire:model.live="startYear"
                                 wire:loading.attr="disabled"
                                 min="{{ $minYear }}" max="{{ $maxYear }}"/>
                        <x-input-error for="startYear" class="mt-2"/>
                    </div>

                    <div class="">
                        <x-label for="endYear" value="{{ __('To Year') }}"/>
                        <x-input id="endYear" type="number" class="mt-1 block" wire:model.live="endYear"
                                 wire:loading.attr="disabled"
                                 min="{{ $minYear }}" max="{{ $maxYear }}"/>
                        <x-input-error for="endYear" class="mt-2"/>
                    </div>
                </form>

                <div class="flex justify-center gap-4 mt-auto h-full">
                    <x-button x-on:click="height > 100 ? height -= 100 : false" class="gap-1">
                        <x-heroicon-m-bars-arrow-up class="w-4 h-4"/>
                        Make Smaller
                    </x-button>
                    <x-button x-on:click="height = 400" class="gap-1">
                        <x-heroicon-m-bars-3 class="w-4 h-4"/>
                        Reset
                    </x-button>
                    <x-button x-on:click="height += 100" class="gap-1">
                        <x-heroicon-m-bars-arrow-down class="w-4 h-4"/>
                        Make Larger
                    </x-button>
                </div>
            </div>

        </div>
    </x-card>
</div>
In my child components that fetch the data I can now simply use $this->startYear and $this->endYear to get the selected range.
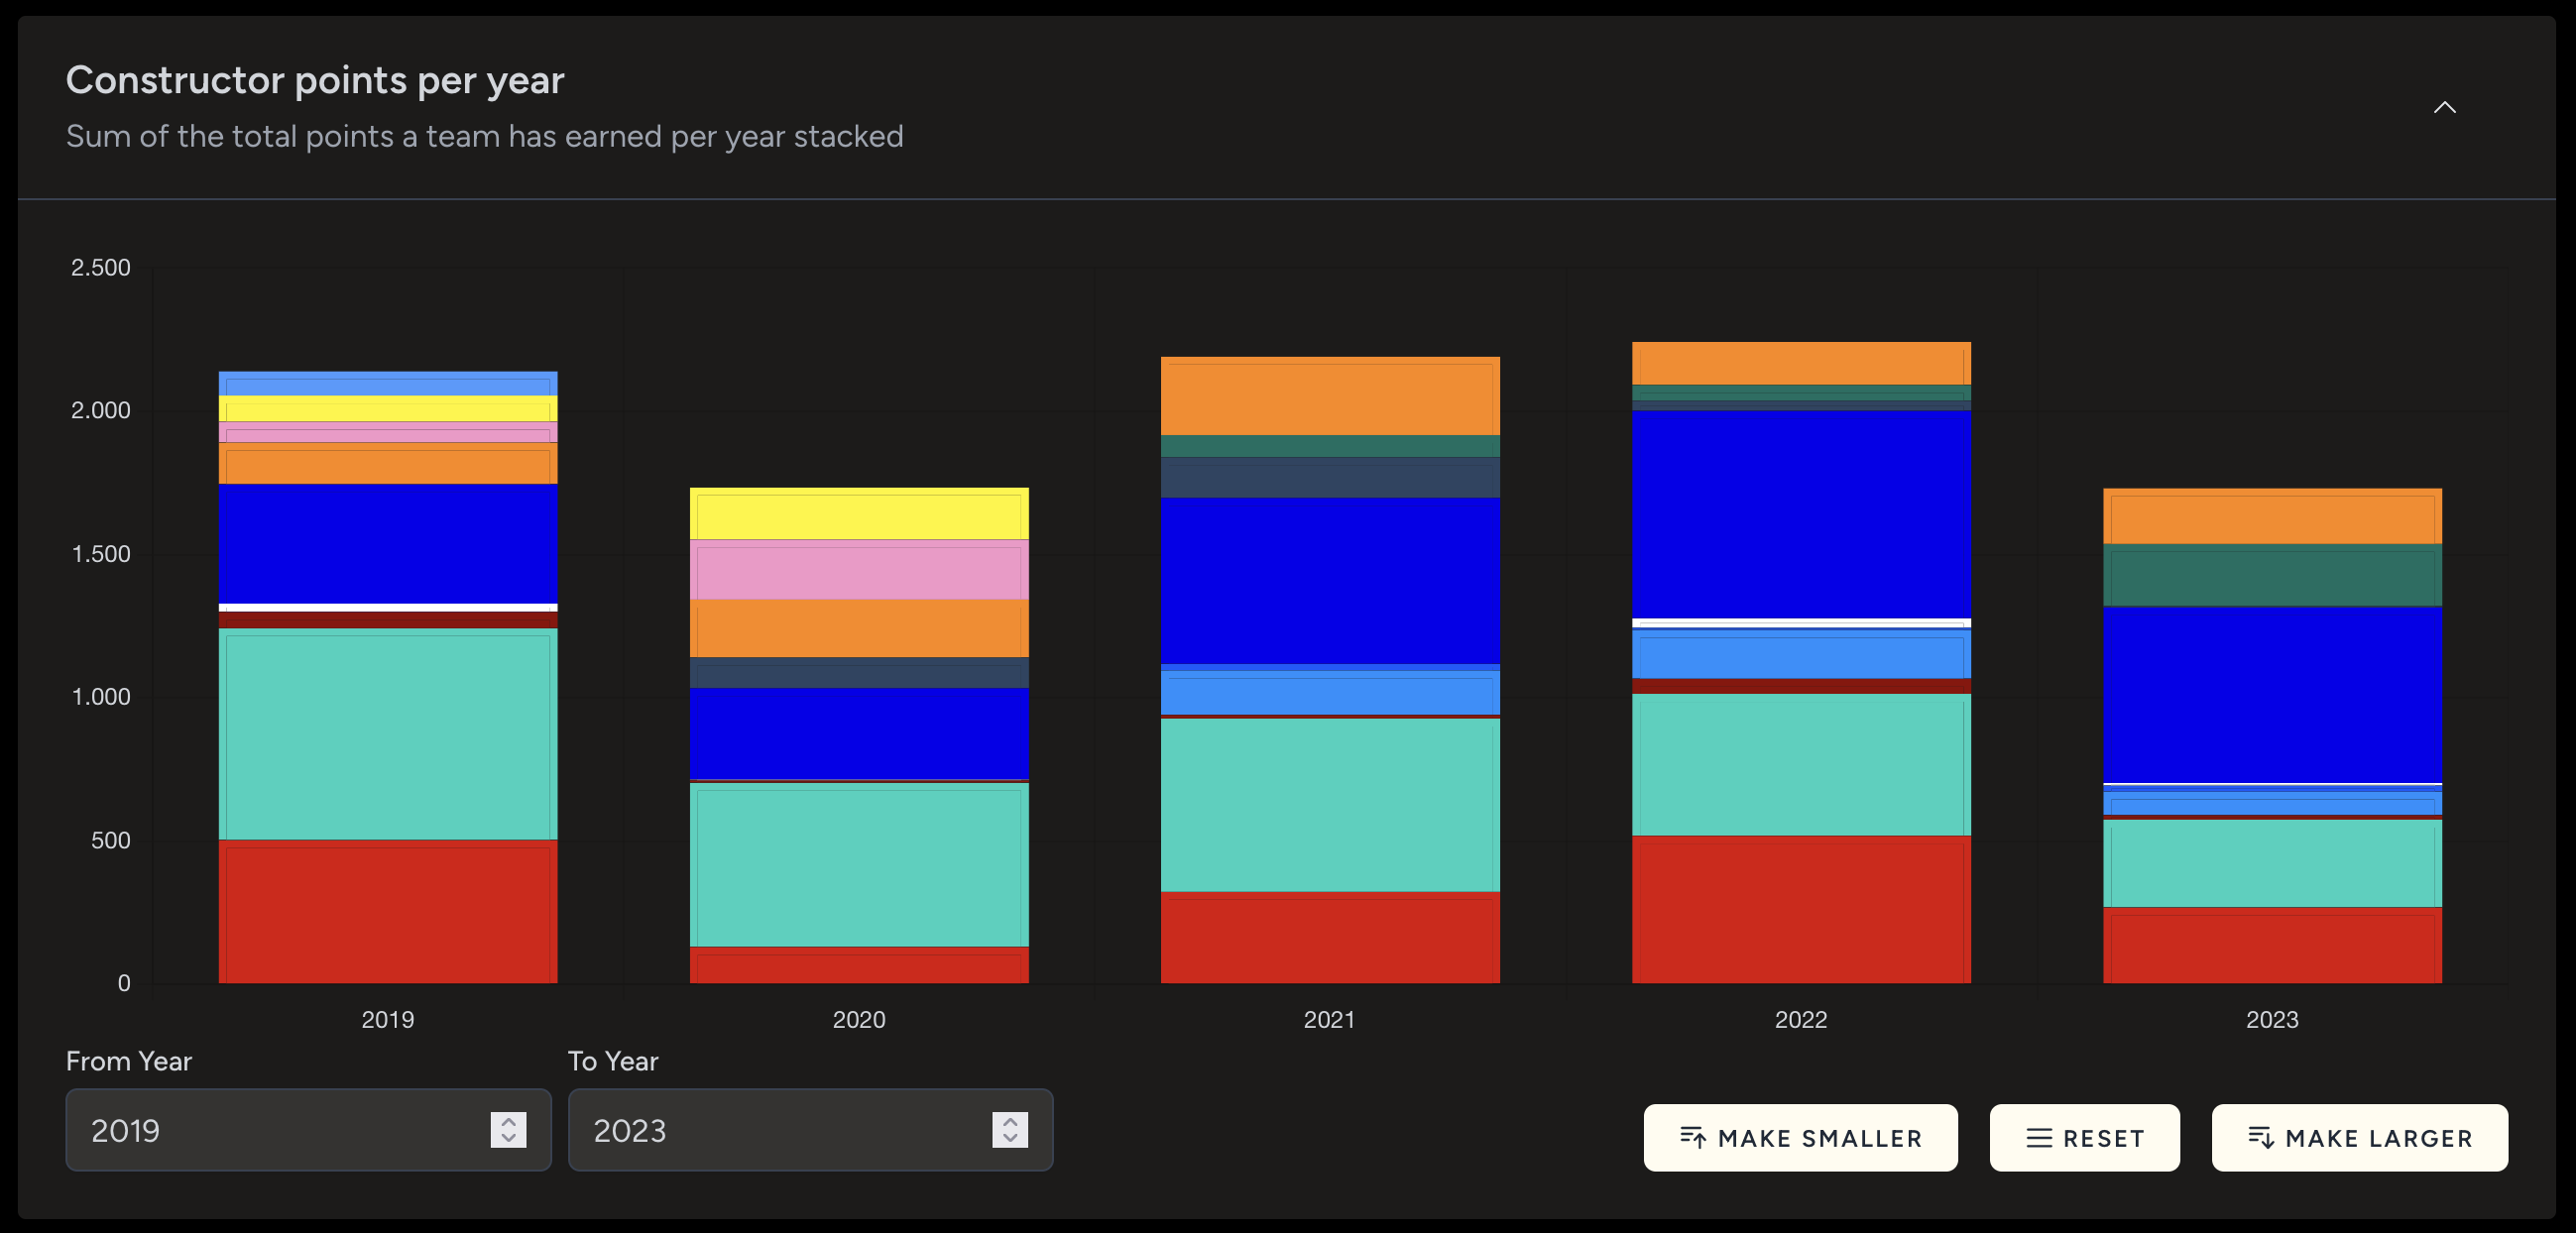
The final chart looks like this:
 Hopefully you have learned something about creating reusable components in Laravel Livewire.